Raydium:$2 关口如何决定 RAY 是涨向 $2.5 还是跌破
Raydium – Why $2 could decide RAY’s next move toward $2.5 or THIS
RAY 在 $2.5 遭遇阻力后下跌 13% 至 $2.15,现货净流出 $1.3M 后转为流入 $0.5M,卖盘量达 370 万。衍生品市场资金净流入 120 万,永续合约交易量激增 670 万,显示交易者仍在布局。若现货压力持续,RAY 可能跌破 20 日均线至 1.8;若资金流保持强劲,则有望守住 2 并重返 2.5。
As the broader market retraced, Raydium [RAY] lost the $2.5 level and dropped to $2.0.
As of this writing, RAY traded near $2.15, down 13% on the daily chart. At the same time, trading volume rose 35%, pointing to heavier risk reduction across the market.
The pullback opened a sharper question for traders. Was spot selling setting the trend, or were derivatives traders preparing for a rebound?
Are spot sellers controlling Raydium?
Raydium [RAY] declined as spot holders panicked and cashed out. On the 12th of October, Spot Netflow dropped sharply to -$1.3 million.
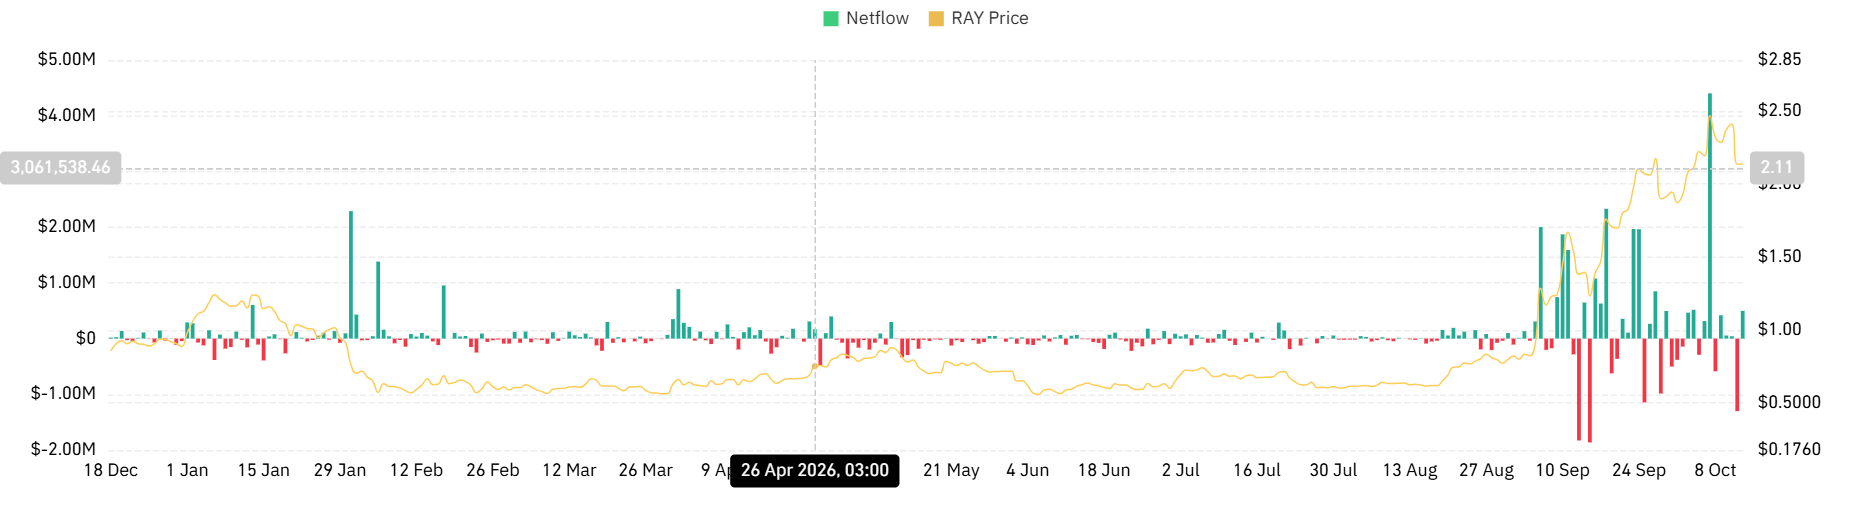
On the 13th of October, Spot Netflow rose to $0.5 million, suggesting higher exchange inflows. The Spot Buy Sell Volume metric also supported this selling-pressure reading.
According to Coinalyze, Spot Sell Volume rose to 3.7 million. By comparison, Spot Buy Volume stood at 2.6 million.
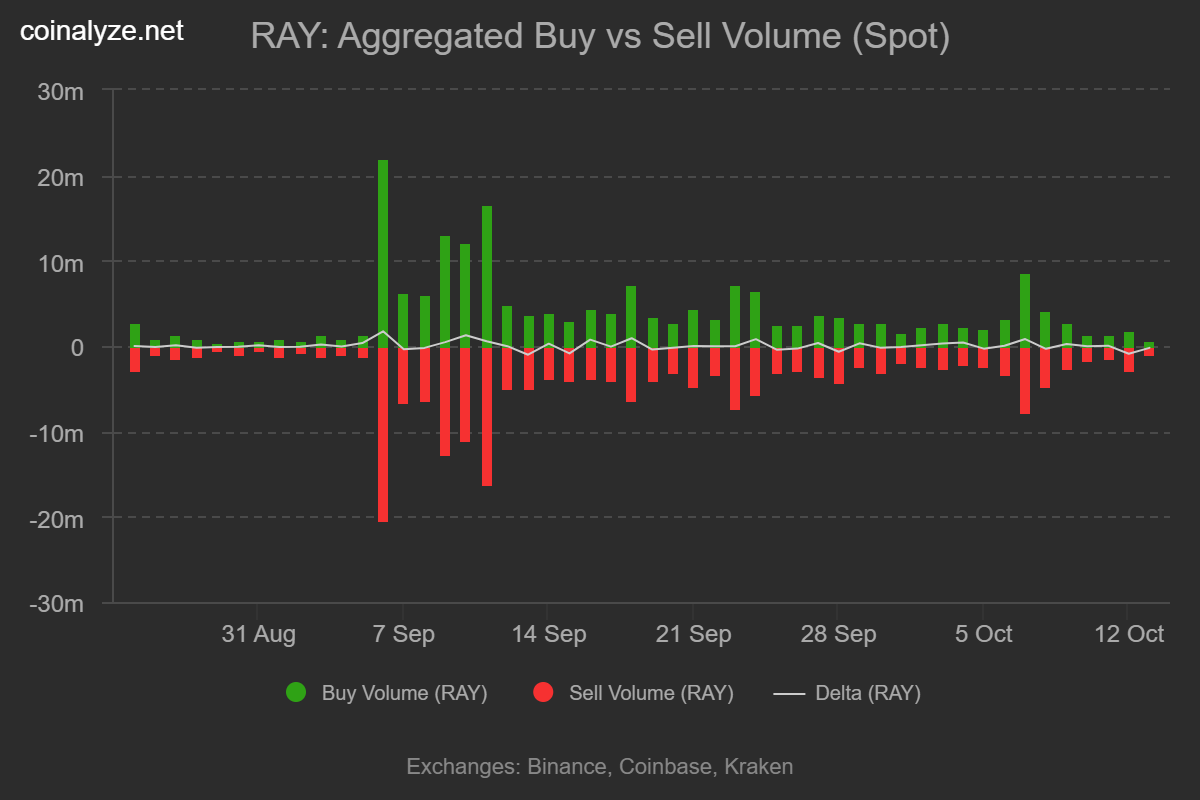
As a result, the Buy-Sell Delta dropped to -1.17 million. A negative delta showed that sell volume outweighed buy volume.
Usually, rising spot selling pressure weakens price action and leaves the market vulnerable to deeper losses.
Are derivatives traders seeing another setup?
Interestingly, RAY’s derivatives market painted a different picture. On the futures side, the altcoin recorded over $9.2 million in inflows and $8.1 million in outflows.
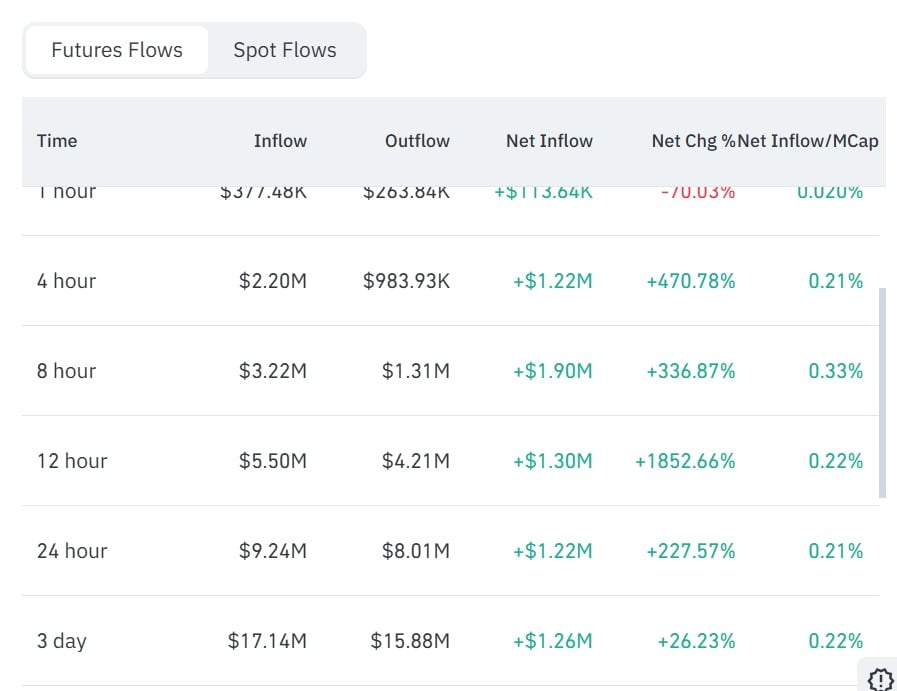
As a result, Futures Netflow rose 227% to $1.2 million. A positive Futures Netflow showed stronger capital movement into the futures market.
On top of that, Perpetual Volume jumped from $3.2 million to $9.9 million. That marked an increase of over $6.7 million.
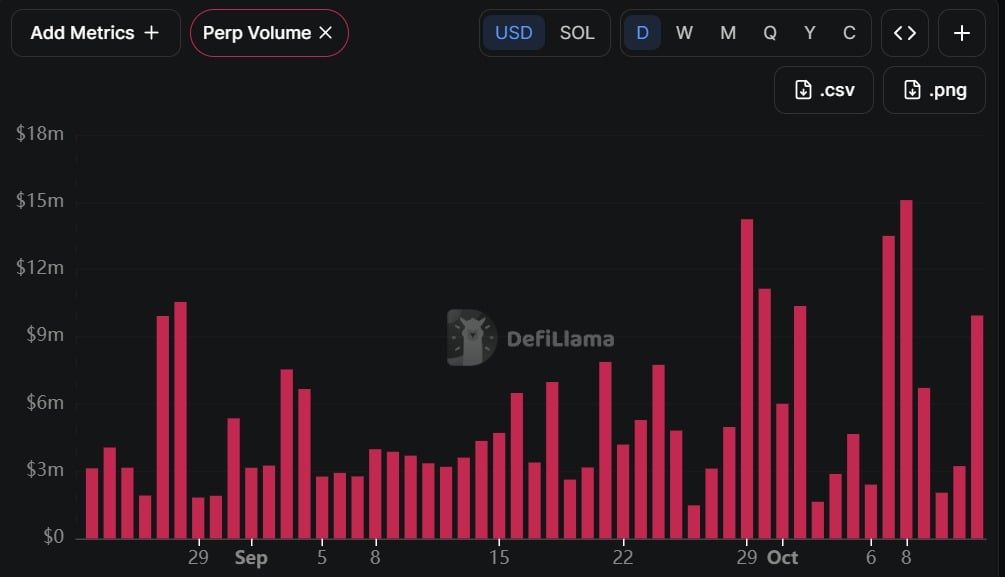
Higher volume, along with stronger Netflows, suggested that traders were still taking positions. Some were likely hedging, while others may have been positioning for volatility.
This is where the article gets more interesting. Spot traders were stepping back, but derivatives traders had not left the table.
Can RAY still defend $2?
Raydium declined mainly because spot-market pressure intensified. As a result, short-term downside momentum strengthened.
Looking at the MACD, the indicator formed a bearish crossover and fell to 0.18. The crossover suggested that bearish momentum was building, with sellers gaining an edge over buyers.
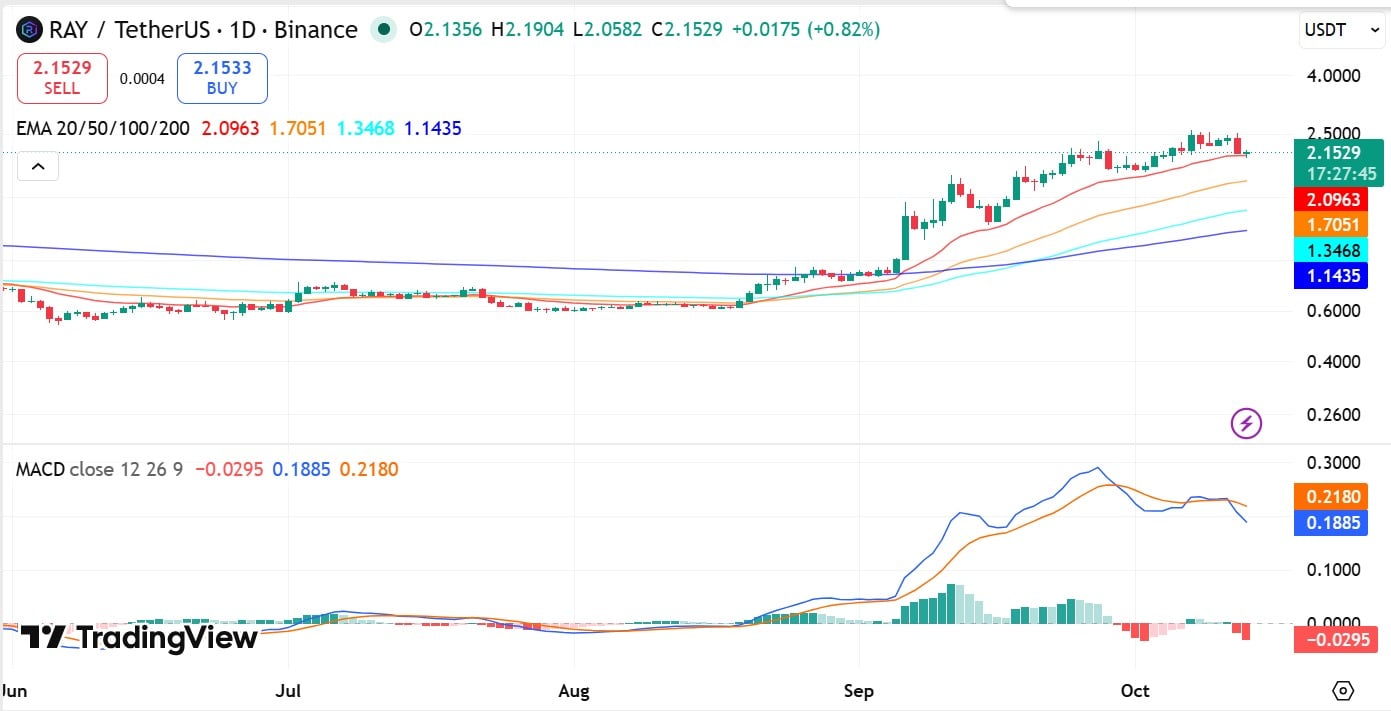
If market pressure continues, Raydium could fail to hold $2.0. In that case, RAY could break below the 20-day EMA and drop to $1.8.
However, derivatives traders have not shown clear panic selling yet. If capital flows remain strong in that market, Raydium could defend $2.0 and reclaim $2.5.
Final Summary
- Raydium [RAY] fell 13% after facing rejection near $2.5 and dropping to $2.0.
- Spot selling intensified, but derivatives inflows showed traders were still active around RAY.
来源:AMBCrypto · ambcrypto.com